
Where is vaccine hesitancy in Canada?
By Esri Canada

Provinces across Canada, like the rest of the world, are in a race to reach herd immunity to slow or stop the spread of COVID-19. While there’s no magic number to reach herd immunity, most research studies estimate that it could be achieved if about 60-75% of the population is vaccinated.
Now, that’s not an easy task.
Aside from limited vaccine supply, governments and public health agencies need to address vaccine hesitancy among Canadians. A recent analysis by Environics Analytics shows that approximately 18% of Canadians 16+ are “unsure” they will get the vaccine; 69% say “yes”, while 13% say “no”.
Many factors affect people’s resistance to getting immunized. It’s important to know:
- Who are they? What are their beliefs, behaviours, and other characteristics?
- What motivates them?
- What communication channels do they use? Can they be reached through TV, radio, out-of-home, print, direct, digital or social media?
- Where are they located?
Using VaccineInsights data from Environics Analytics, Esri Canada has mapped vaccine hesitancy levels by health unit across Canada, including socio-demographic data (age, sex, education, household population, marital status, etc.).
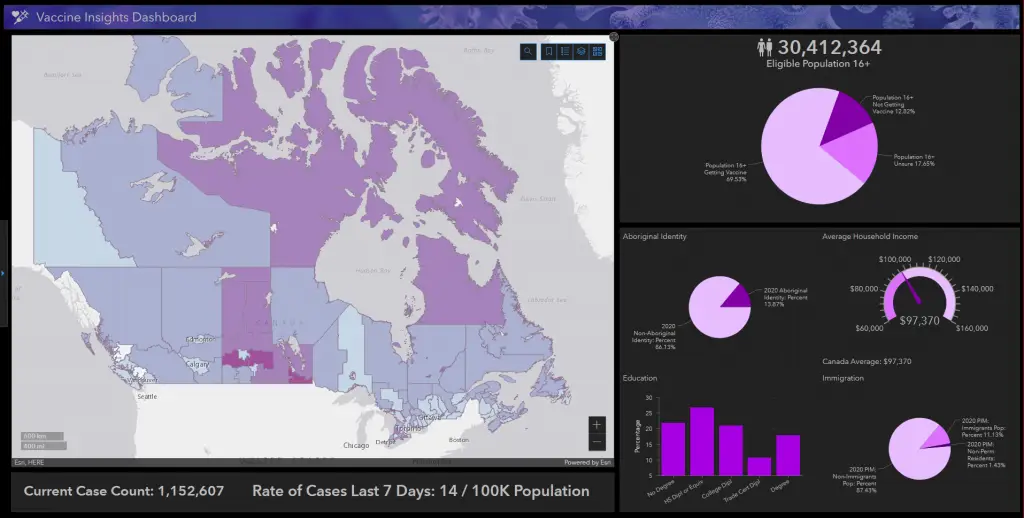
A closer look at this map dashboard could help government and public health professionals identify and understand where vaccine-hesitant populations are in their community and improve targeting of communications.
This map is one of the many resources available in the new CHIMA GeoHub, powered by geographic information system (GIS) technology. It uses Esri’s cloud-based mapping and spatial analysis software ArcGIS Online and hub technology ArcGIS Hub.
In the GeoHub, you can access recordings from the recent webinar series “Using GIS from Data Gathering to Storytelling” and several tutorials that cover a wide range of topics, including:
- Making maps with your data
- Geo-enabling your spreadsheets or tabular data
- Monitoring COVID-19 cases
- Mapping disease outbreaks
- Understanding the socio-economic factors of diabetes
- Fighting child poverty using demographic analysis
- Analyzing where healthcare costs the most
- Siting a new hospital
- Planning routes for restaurant inspectors
- Creating healthcare facilities dashboards
CHIMA members have access to the Using GIS from Data Gathering to Storytelling 3-part webinar series. This series is worth 4.5 CPE credits with the Canadian College of Health Information Management. To access this series, please sign in to the dashboard area at echima.ca, locate ‘My exclusive offers’, and select ‘Esri Canada’.
Esri Canada has created a CHIMA GeoHub for educational purposes to provide members with a platform to explore using GIS for mapping and spatial analysis. It is recommended to review the webinar series first before practicing in this software.
To learn more about the different uses of GIS in Public Health, visit esri.ca/chima